
An experiment in Kenya has been exploring the influence of large herbivores on plants.
Download the data on Acacia for the
experiment
into a data subdirectory and read it into R using the following command:
acacia <- read.csv("data/ACACIA_DREPANOLOBIUM_SURVEY.txt", sep="\t", na.strings = c("dead"))
CIRC on the x axis and AXIS1 (the maximum canopy
width) on the y axis. Label the x axis “Circumference” and the y axis “Canopy
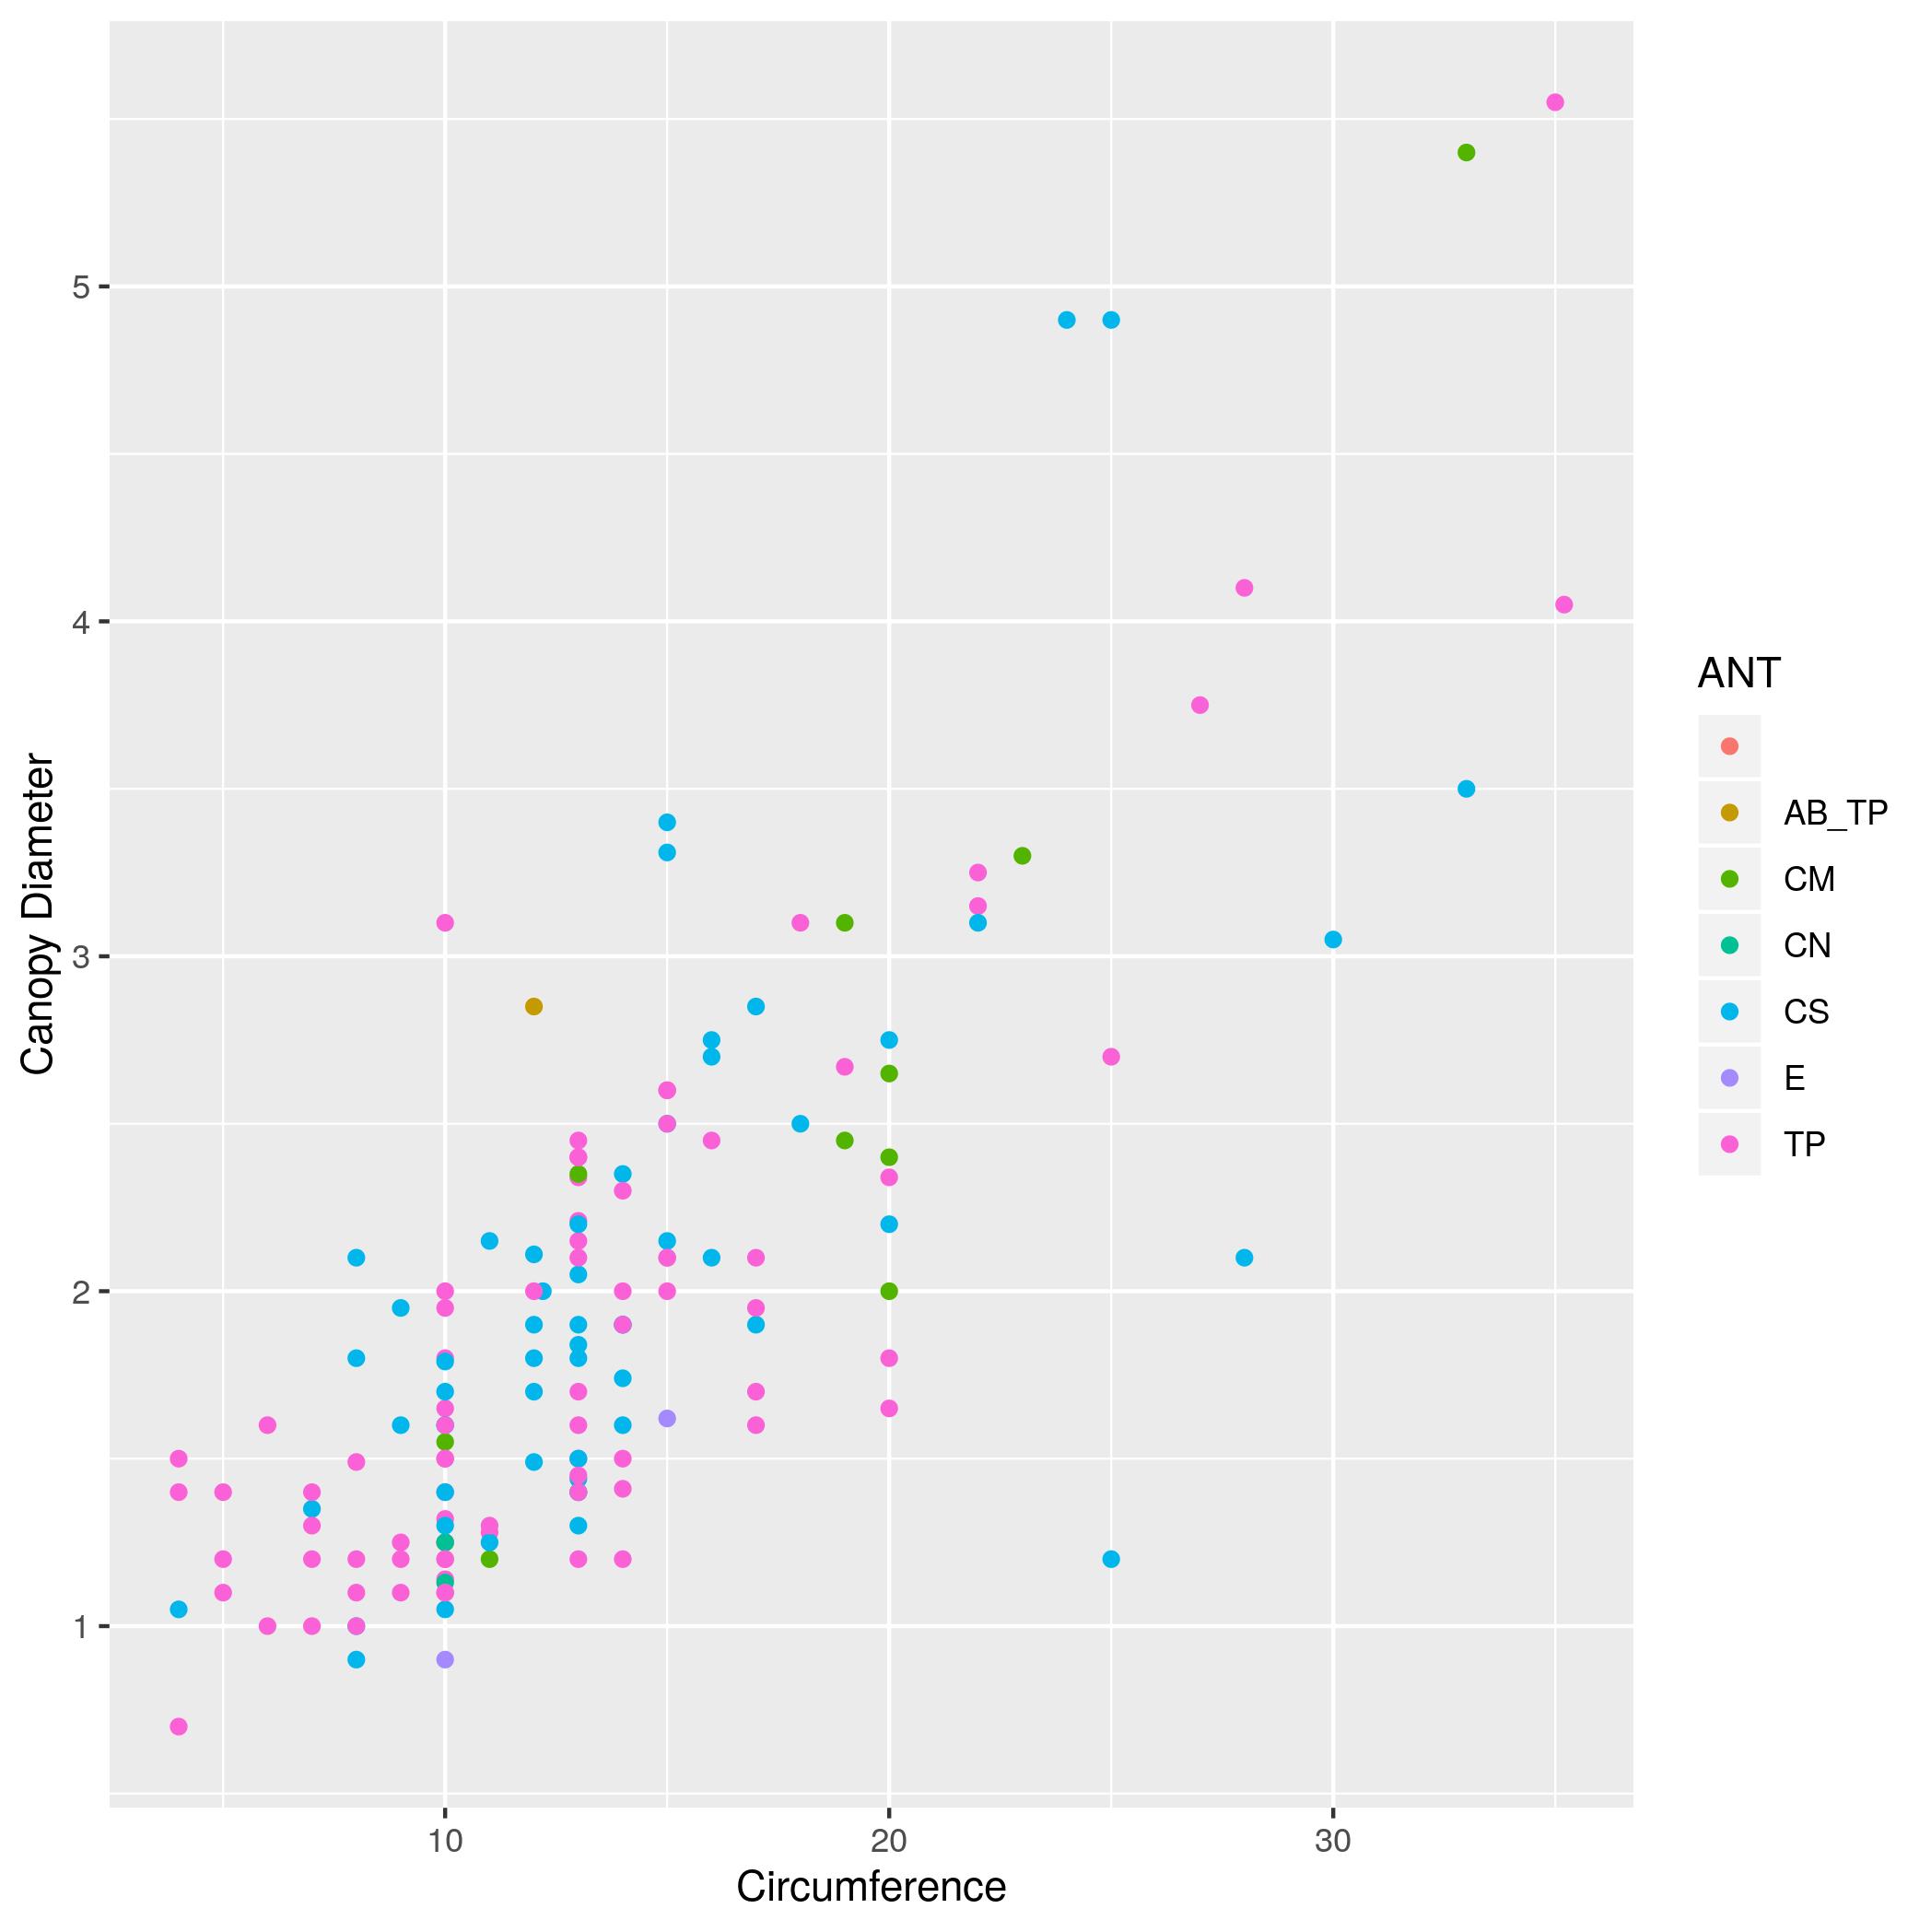
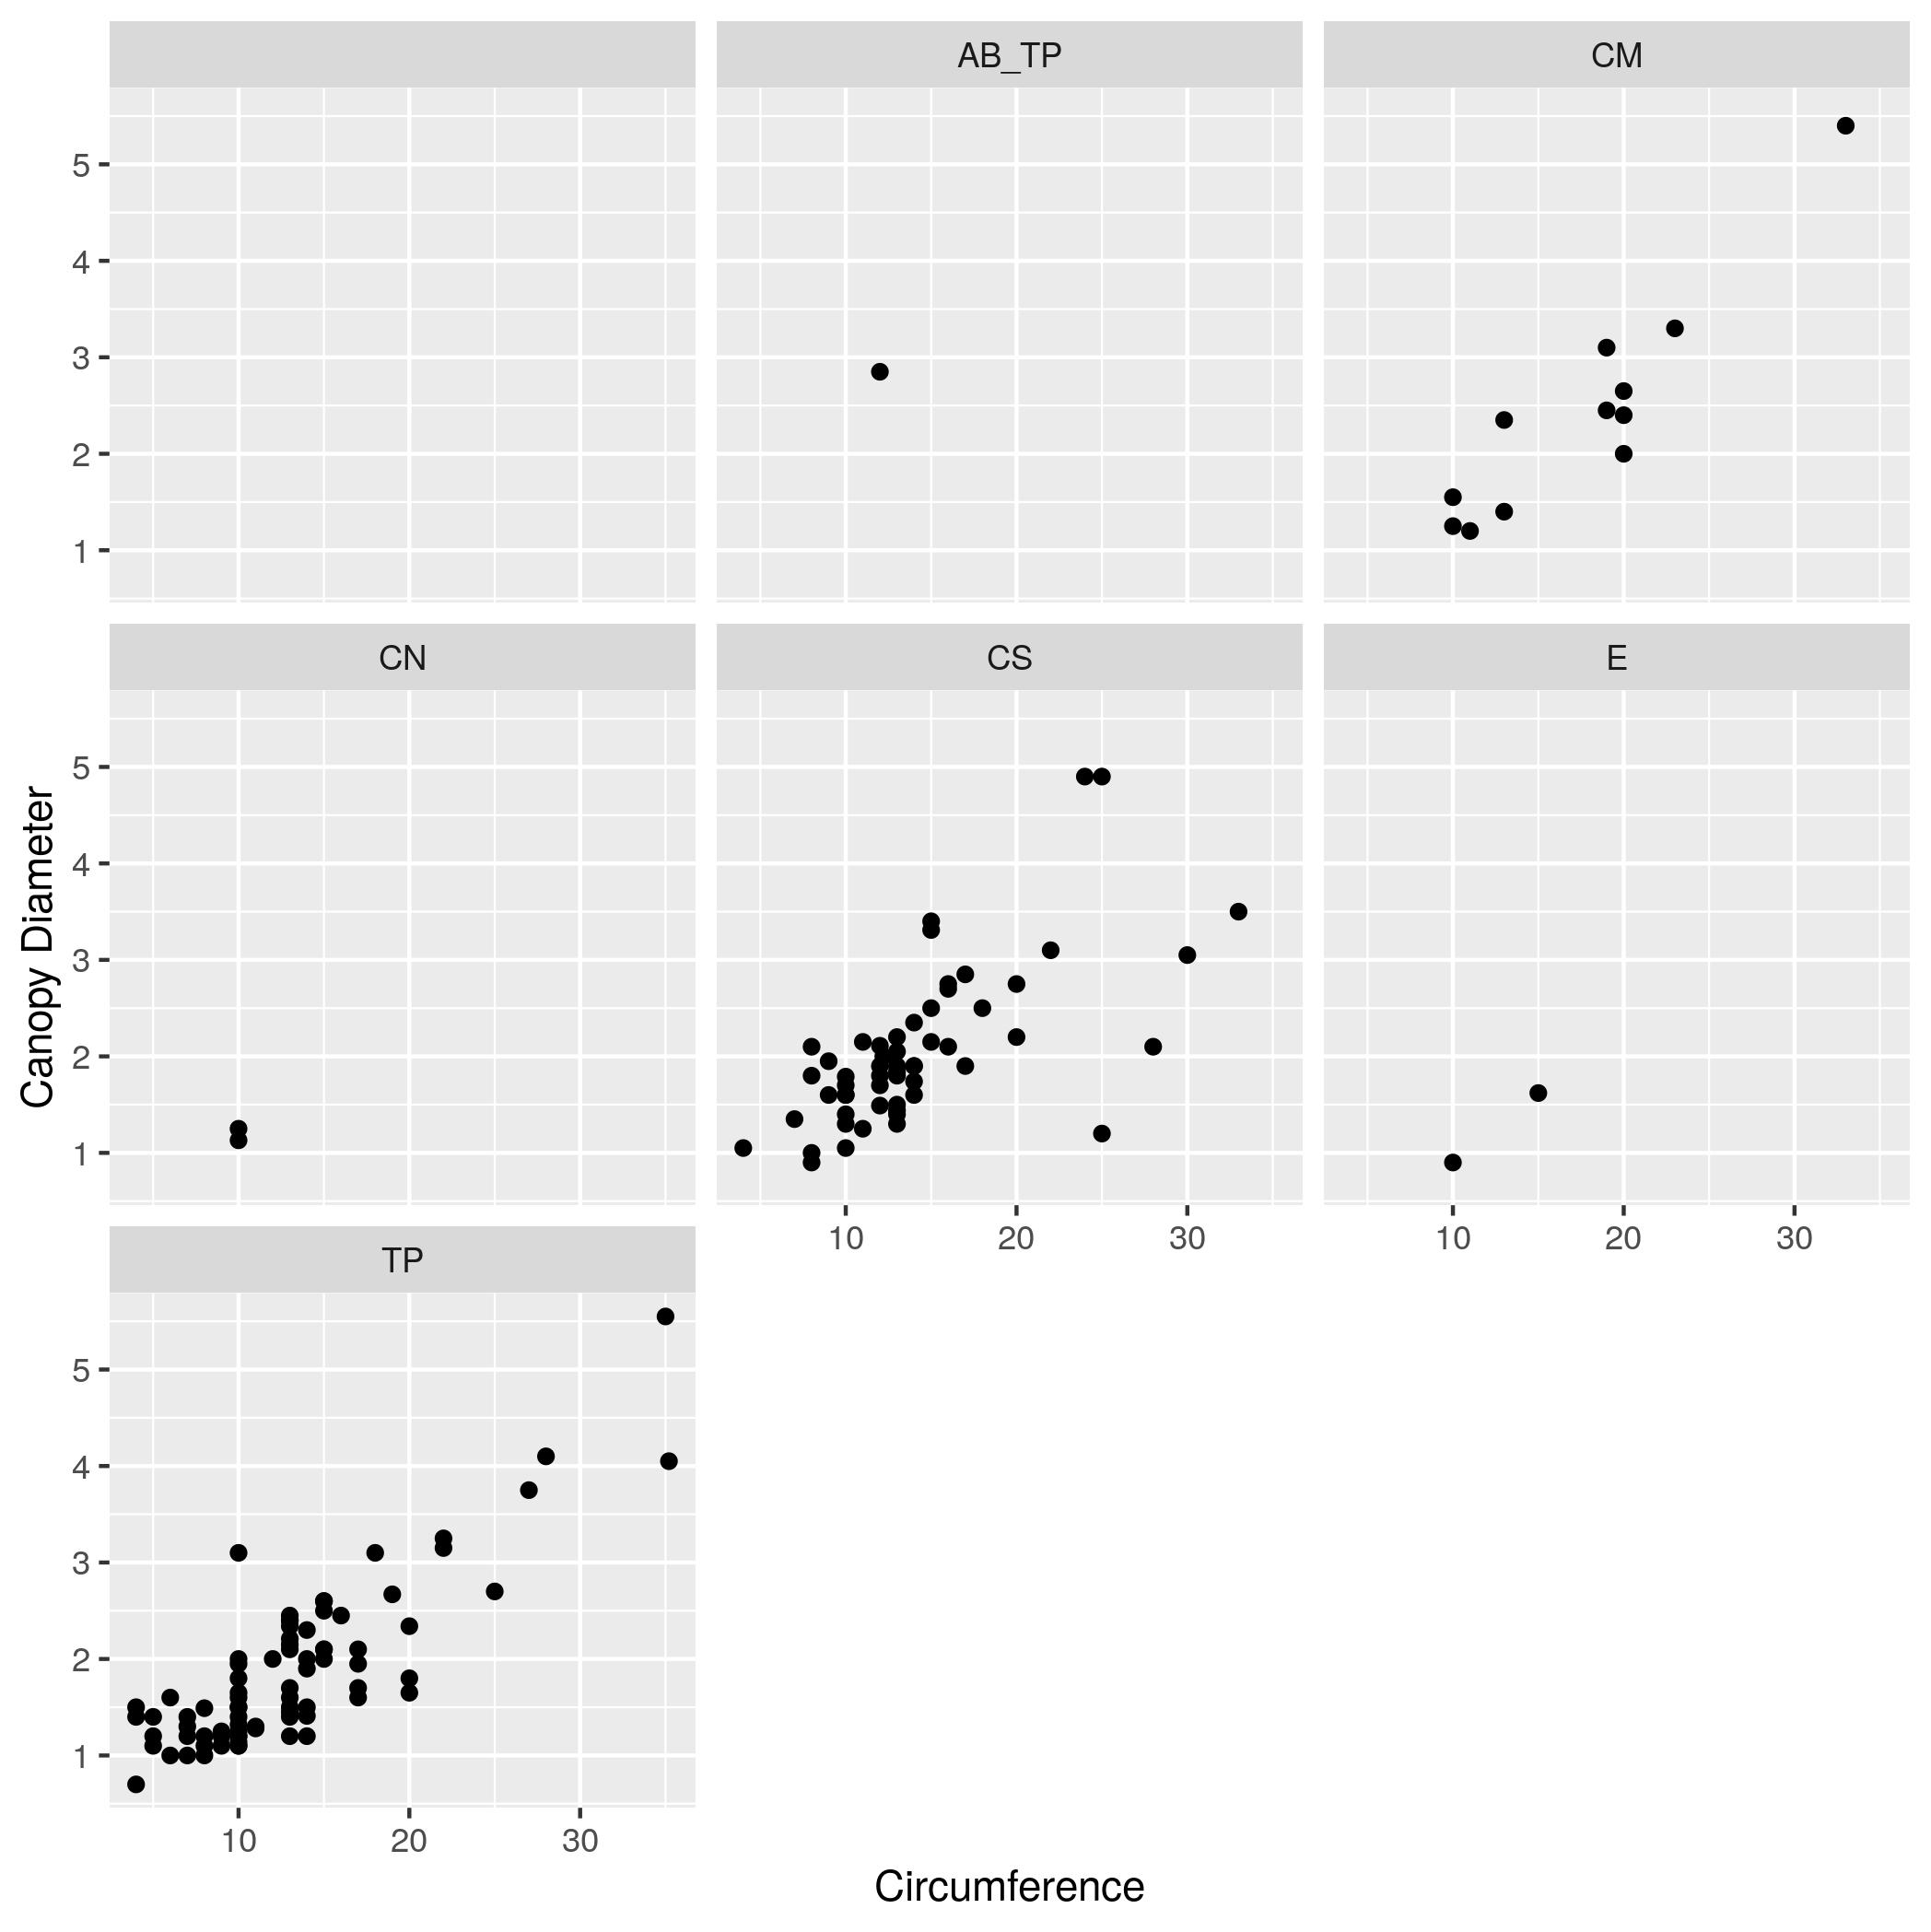
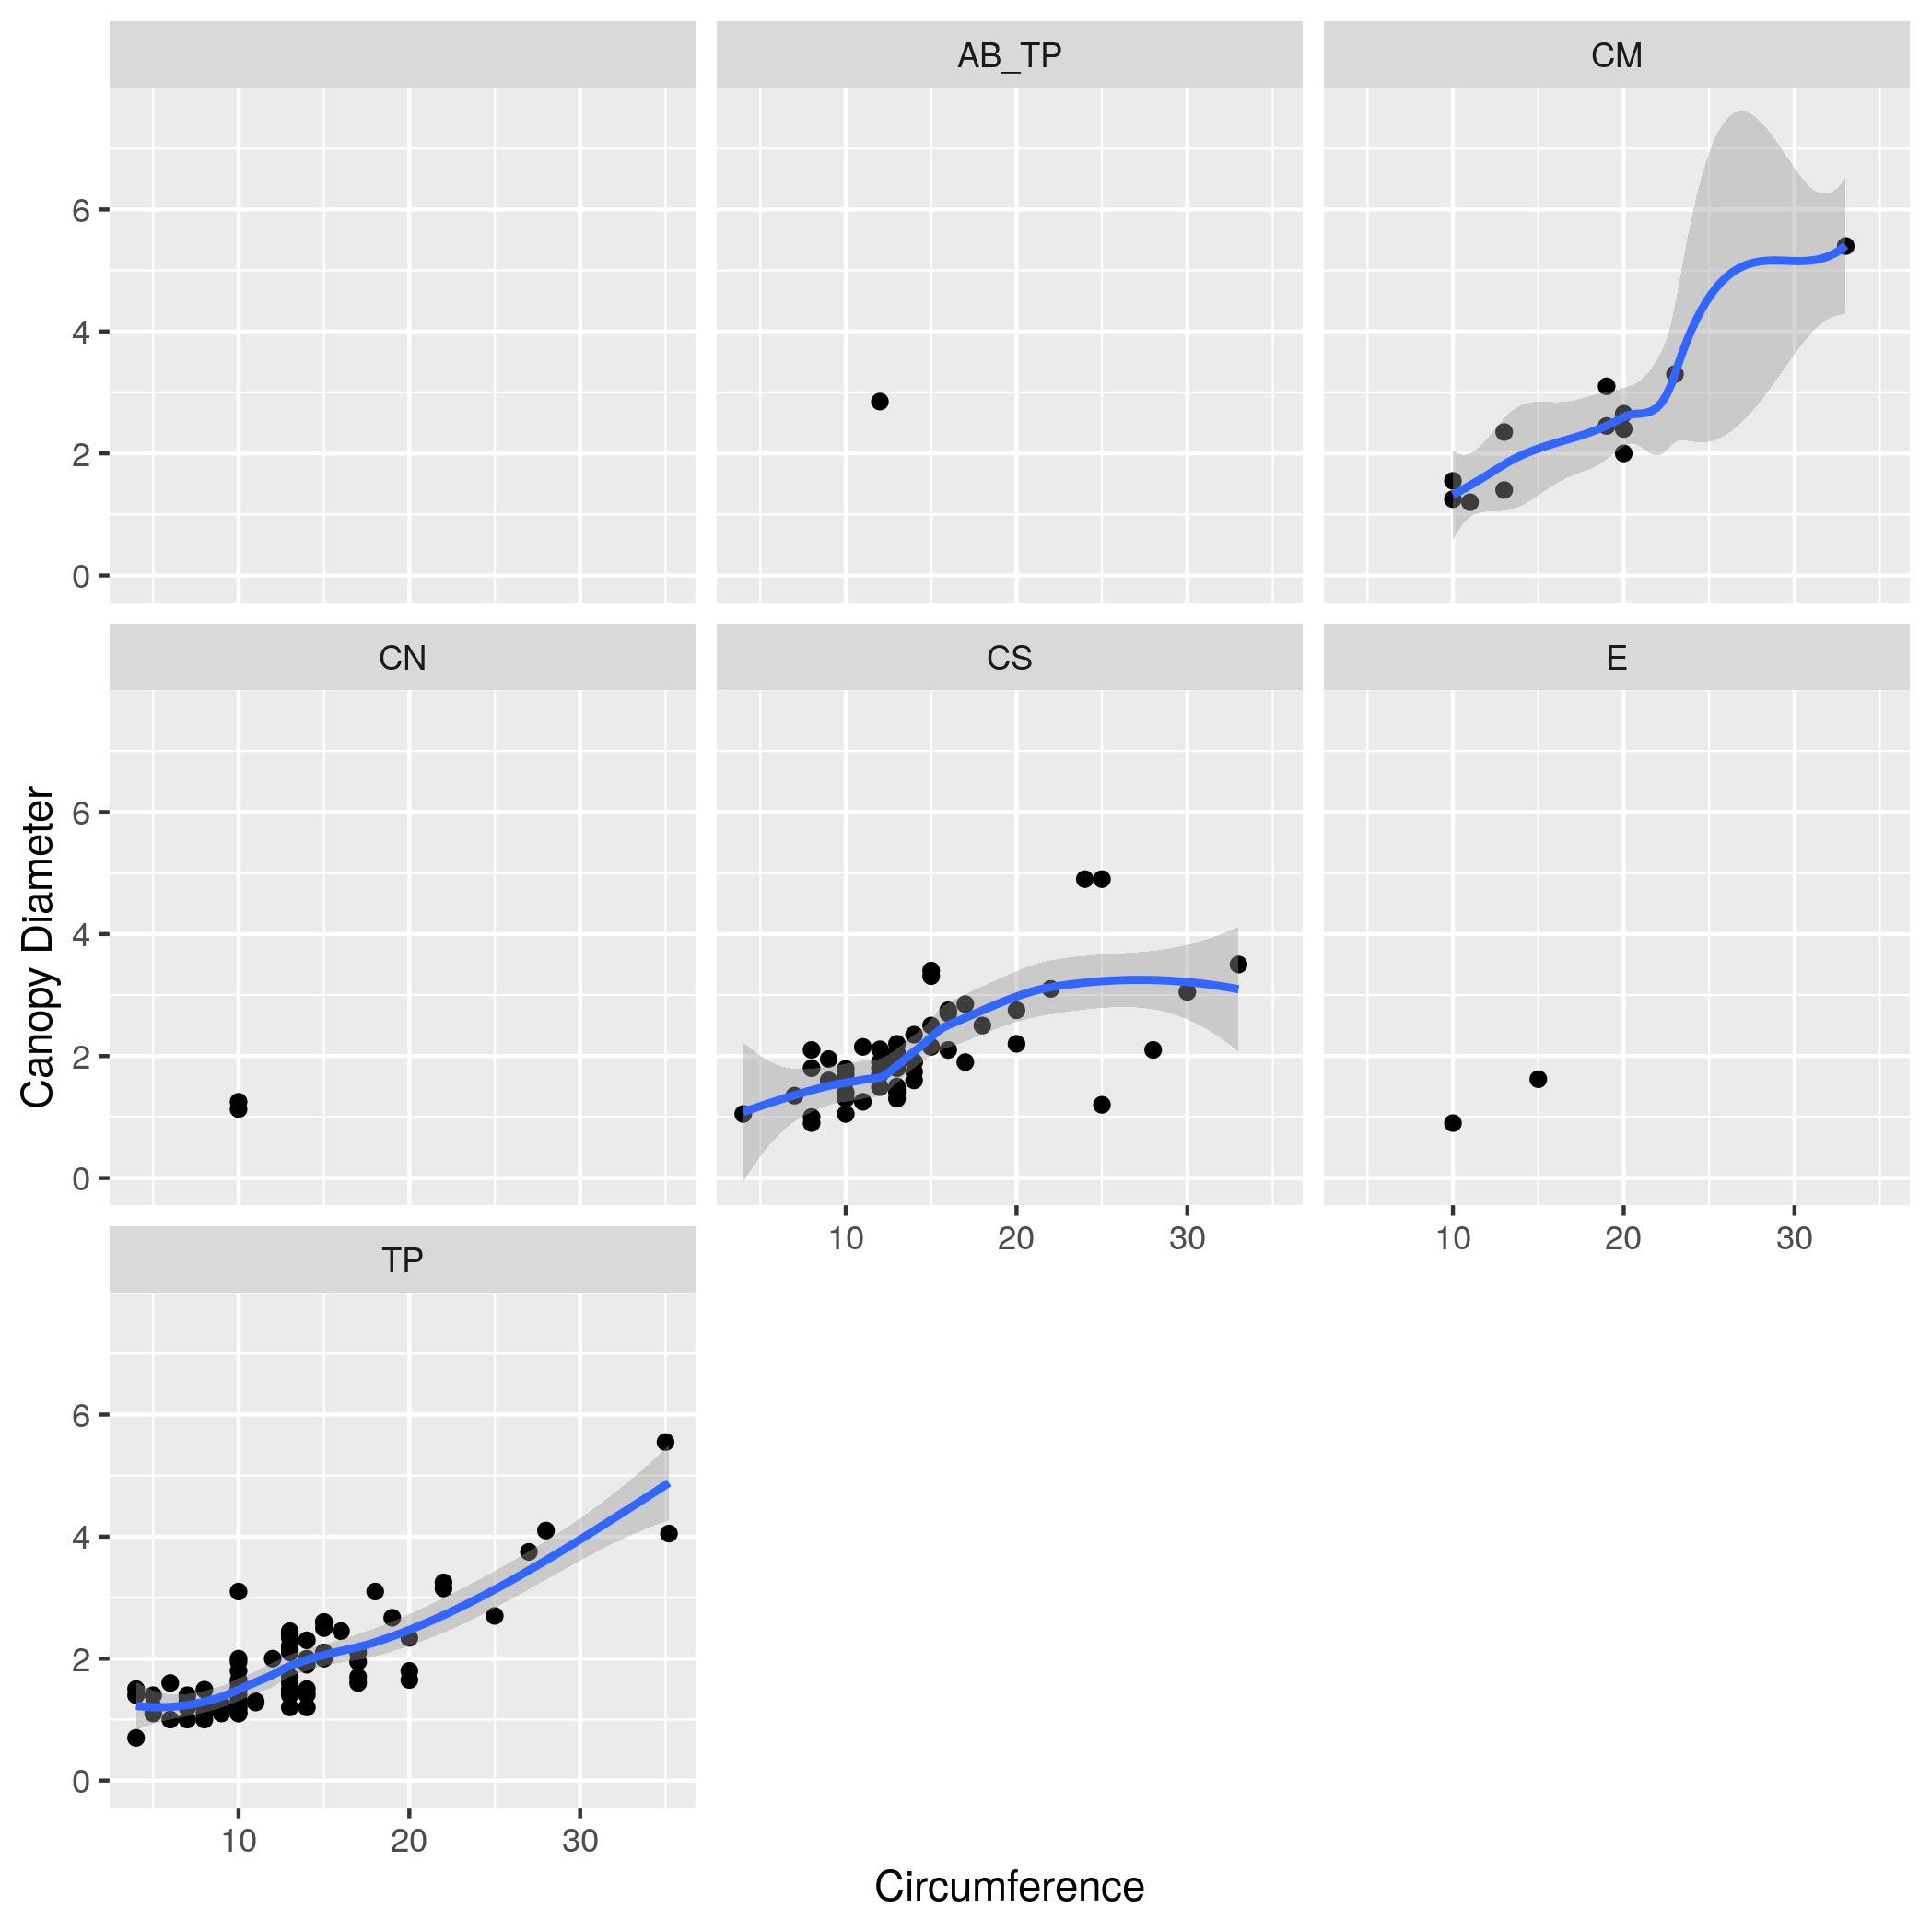
Diameter”.ANT column (the species of ant symbiont living with the acacia)ANT) each in a separate subplot.geom_smooth.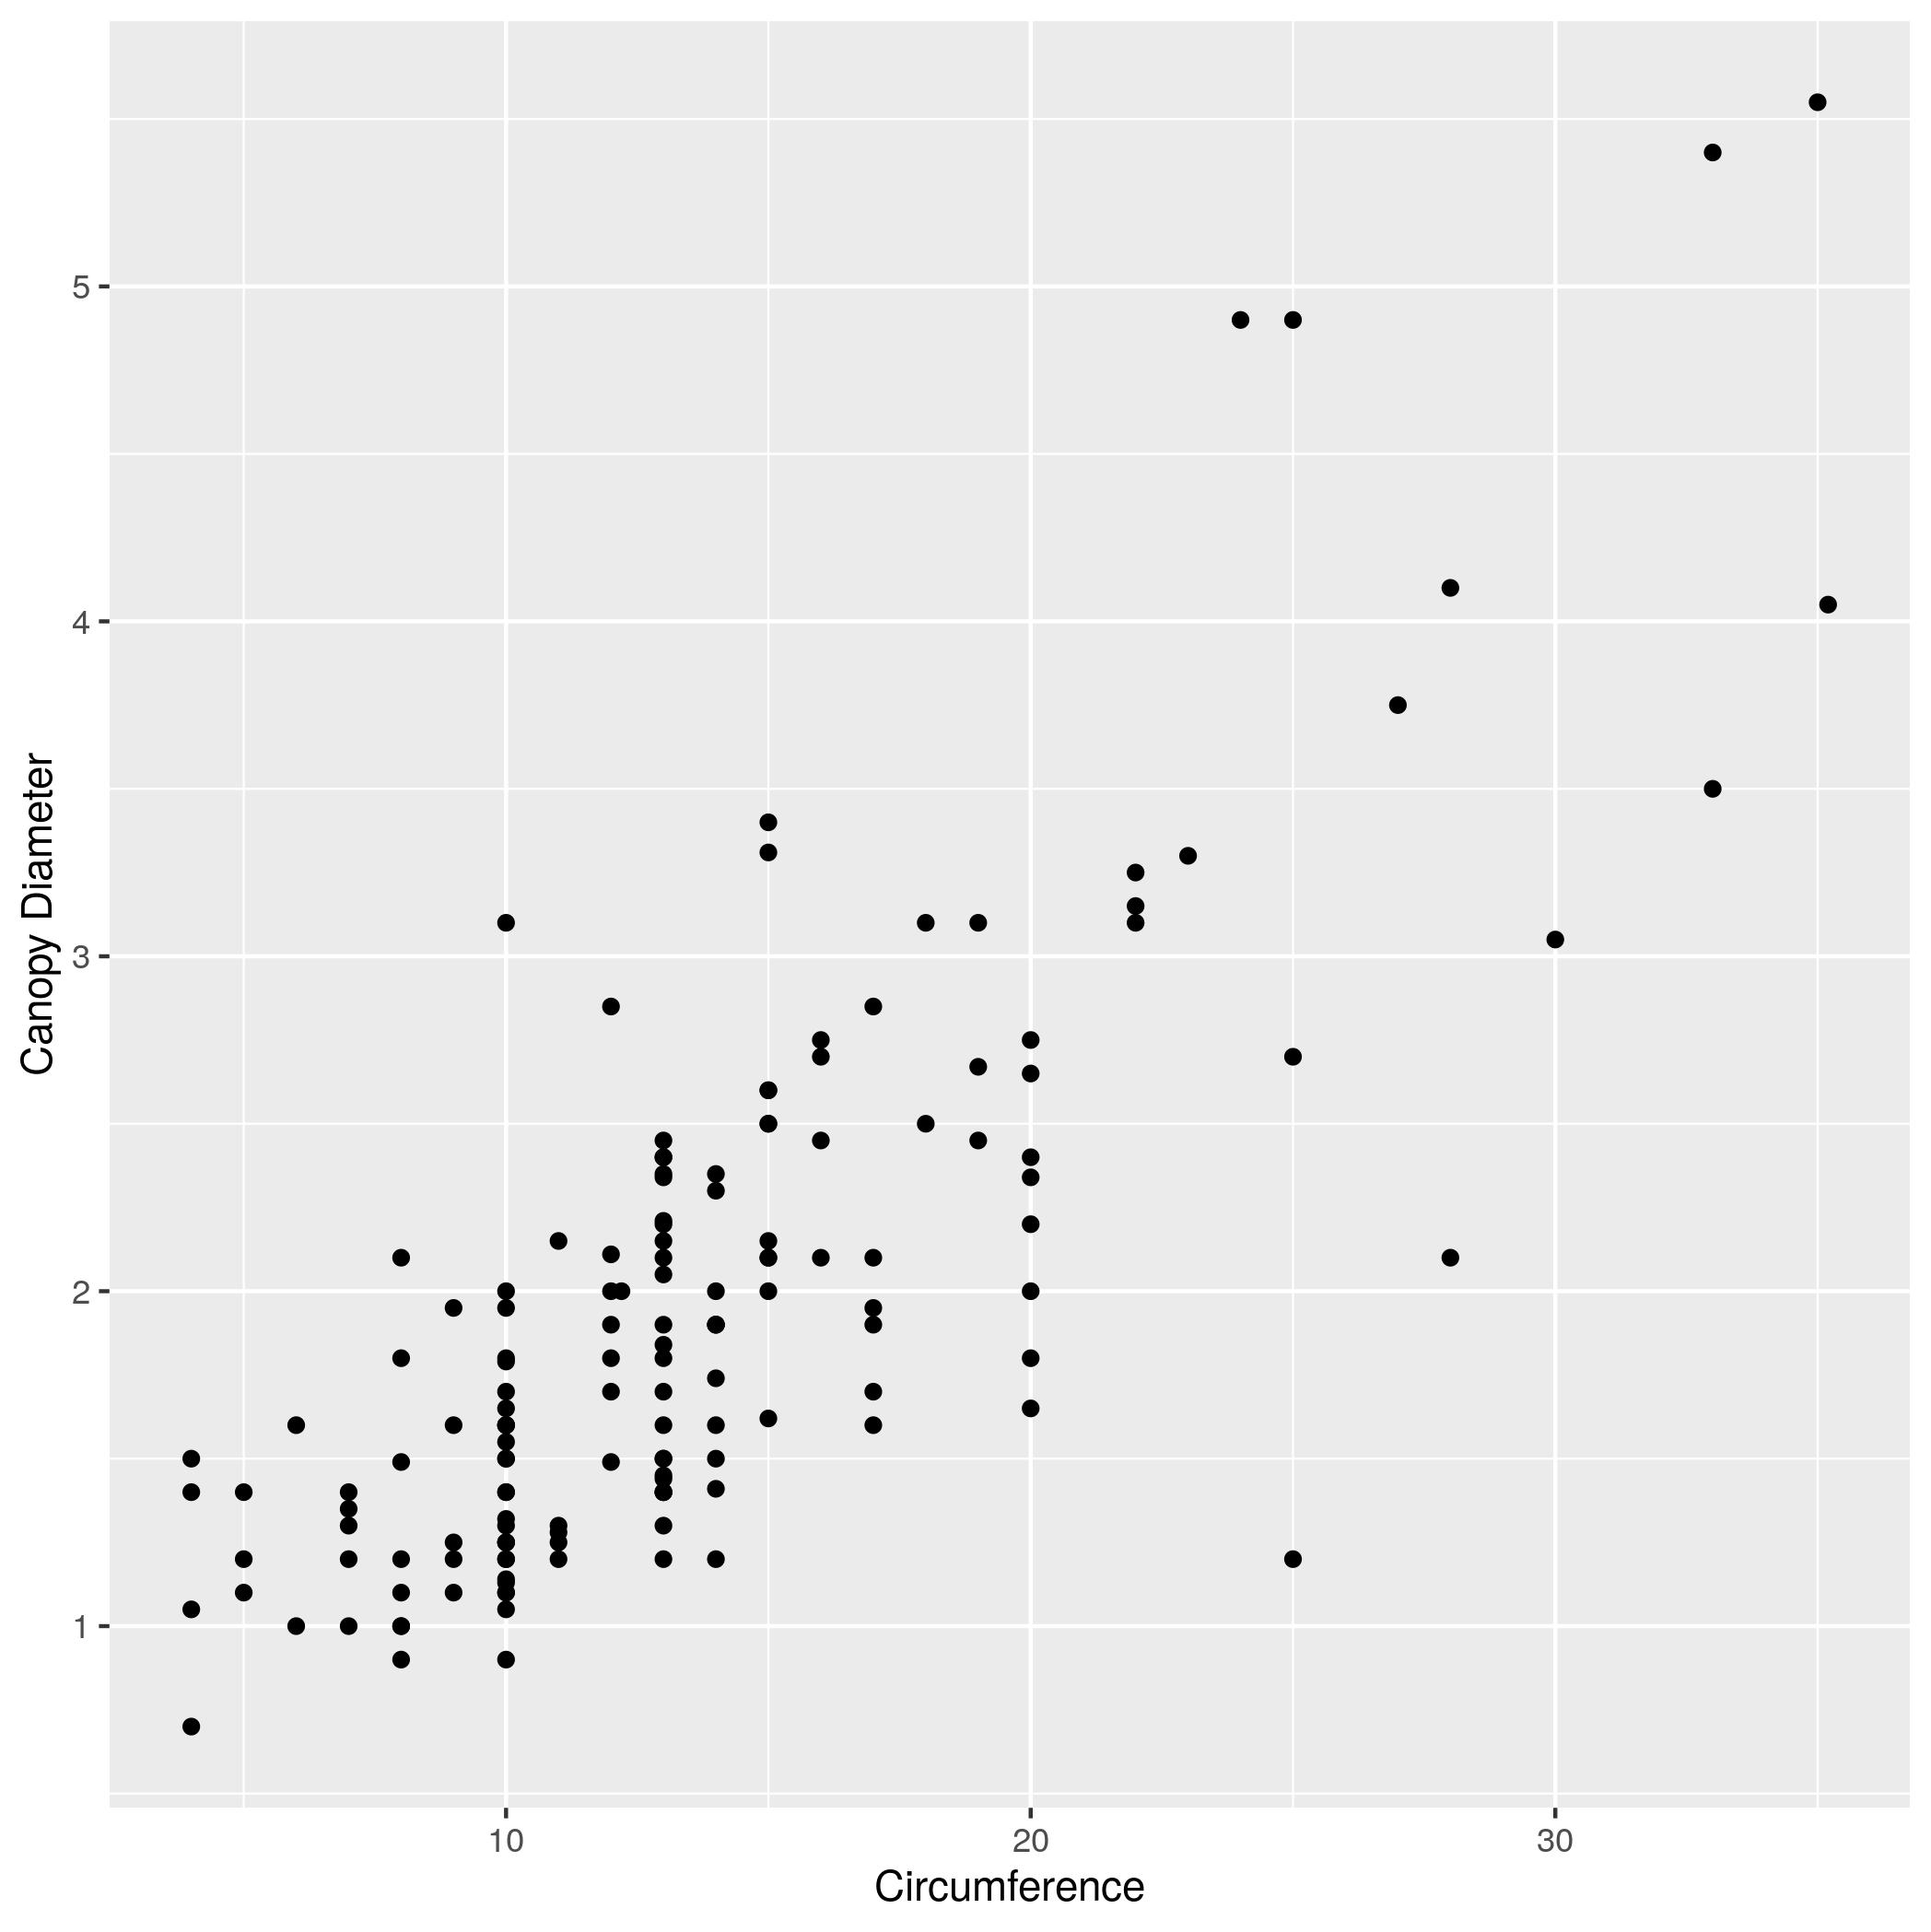